Las Vegas Real Estate Market Trends
Published On: July 20, 2015 Posted by: Millie Fine
What’s up with the market? Where is it headed! These are often asked questions and as a experienced agent it is expected that I will have some feedback. In truth, I never know. There are so many variables that can affect the local market that it is impossible to know. Plus as an agent that depends on both buyers and sellers for my living I do have a vested interest and may rightfully be suspected of not being objective. Find a buyers agent that at anytime over the last years that was not positive as to the immediate future of the market. They are a rare breed.
Consider what may happen in Europe, China or the United States that could drastically affect this marketplace as well as what could happen locally and you see the dilemma. Why are there so many prognosticators? Because there is a living being an “expert” irrespective of the fact that they are very often wrong. If they are, that is quickly forgotten, but if they happen to be right a couple of times in a row, they become a “sage”.
O.K. that is my moment of truth. What I can do for you is show you the present state of the market and were it is trending at this point of time.
Prices are now just below the prices of June 2008. and show a 8.3% increase over the last 12 months. The raw data for this calculation is courtesy of the Greater Las Vegas Association of Realtors. 14% of homes closing escrow in June 2015 were either bank owned or short sales. The short sales and foreclosures as a percentage of closings is down somewhat and will likely continue a downward trend.
A snapshot of the market as of July 13, 2015 shows 7,319 free standing homes on the market. May 2009 the figure was 13,346. The rate of sales has increased substantially over the last couple of years with the inventory shrinking considerably. Consider November 10, 2007 to December 10, 2007, when 944 homes went under contract. 2,933 free-standing homes went under contract in June. The National Association of Realtors regards a 5 to 6 month inventory of homes as a neutral market, neither a buyer’s or seller’s market. There is now just over a 2 month supply of homes available at the current rate of sale.
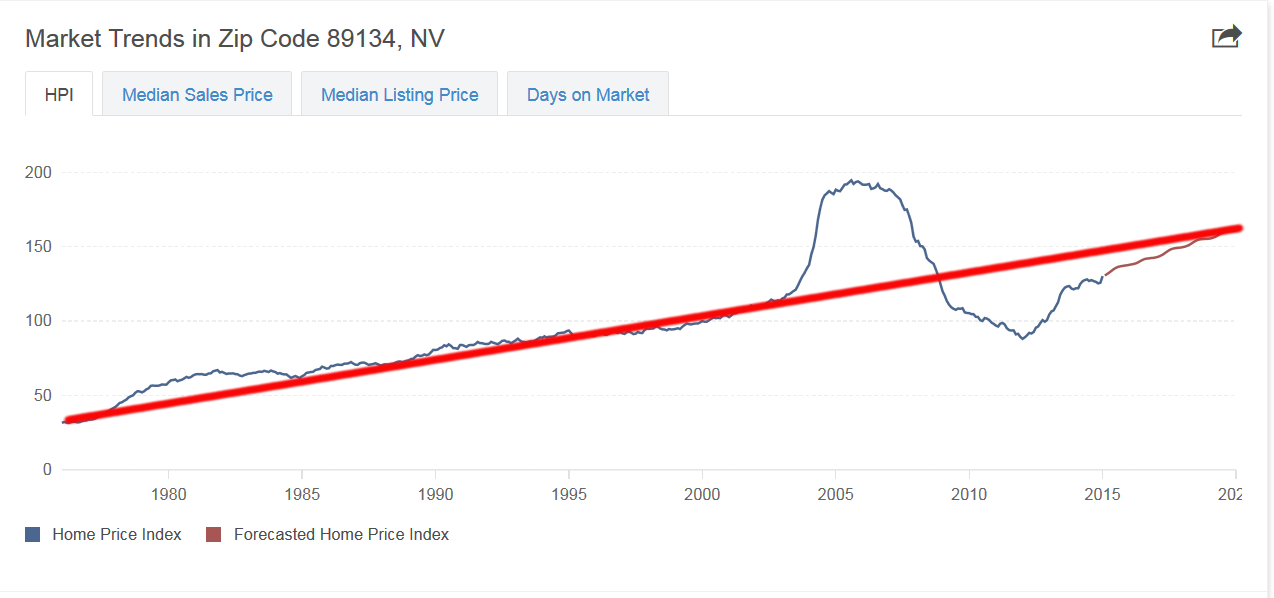
The median sales price for a free-standing home in August 2006 was $319,000. That was the peak for this market. From the prices went down dramatically until March of 2012 when the median price bottomed at $120,000. The median sales price for a free-standing home in June of this year was $220,000. For more information regarding the current market see my market overview page on my web site. If you have an interest, I show along with other data, the median selling price and asking price for almost every month for the last nine years.
View the graph displayed. What I have done is to draw a straight line through the historical price figures. This shows that, exempting the bubble, burst and then recovery, the trend line for prices for many years has shown some consistency. I have taken code 89134 for this trend line, but any local zip code would have roughly the same trajectory.
In my future blog posts I hope to feature some of the local planned communities. In particular how they compare to the other choices. I will also do a monthly update as to what is happening to the overall market.
That’s it for now. Feel free to comment, call or email me with any feedback of questions.